
This little-known $1.6 billion fund trades at a 23% discount while holding 41% of its portfolio in Warren Buffett’s Berkshire Hathaway. But is this deep value play too good to be true? Let’s break down the numbers, management strategy, and hidden risks.
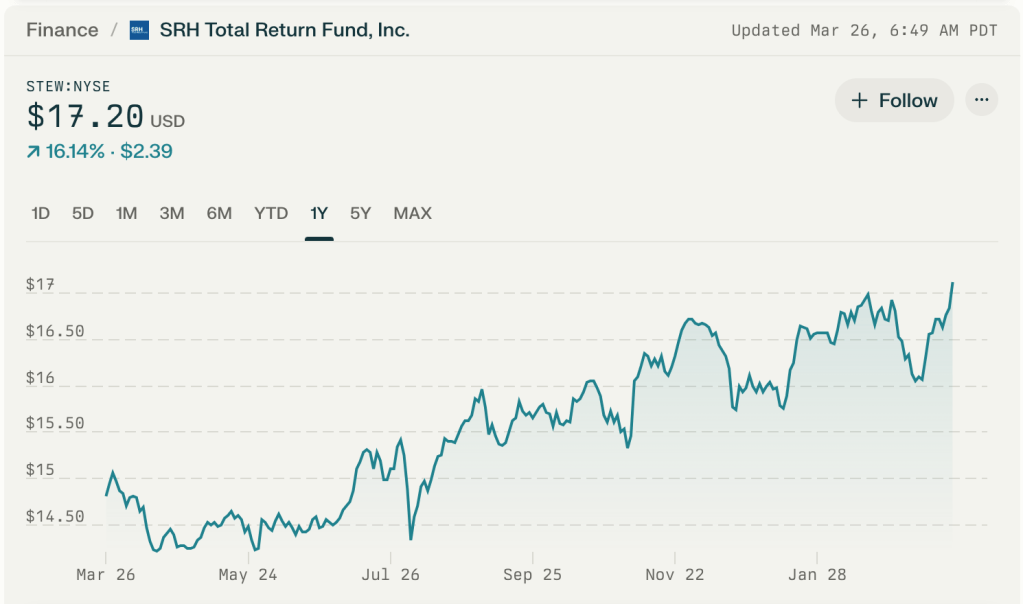
The chart shows a steady upward trend in STEW’s price over the past year, with the following key points:
- Starting price on March 26, 2024: $14.19
- Ending price on March 26, 2025: $17.18
- Overall price increase: $2.99 (21.1% gain)
What Makes STEW Unique?
SRH Total Return Fund (STEW) operates like a “best-of” portfolio managed by financial professionals with direct ties to Berkshire Hathaway. Here’s what stands out:
- Berkshire Concentration: 41% of assets in Berkshire stock (compared to 0% in S&P 500 index funds)
- Deep Discount: Shares trade at $16.84 vs. $21.85 net asset value (-23% gap)
- Value Metrics: P/E ratio of 2.98 vs. S&P 500’s 25.7
- Income Stream: 3.92% dividend yield with 15% payout ratio
Key Metrics at a Glance
| Metric | STEW | S&P 500 |
|---|---|---|
| P/E Ratio | 2.98 | 25.7 |
| Dividend Yield | 3.92% | 1.35% |
| 5-Year Beta | 0.92 | 1.0 |
| Top Holding | 41% BRK.B | 7% AAPL |
The Berkshire Connection: Smart Money or Overexposure?
Management Ties to Omaha
Portfolio managers Joel Looney (24 years experience) and Jacob Hemmer (CFA) have structured the fund with three Warren Buffett principles:
- Concentrated Positions: 75% in top 10 holdings
- Cash Reserves: 5% cash buffer for market dips
- Value Focus: Seeks stocks trading below intrinsic value24
This approach helped STEW match the S&P 500’s 20% returns over the past year despite its conservative tilt3.
Why So Much Berkshire?
- Built-In Diversification: Berkshire itself holds 60+ subsidiaries
- Cash Safety Net: Berkshire’s $157 billion cash pile acts as a market crash cushion
- Succession Planning: STEW managers believe Berkshire’s next leadership will maintain strategy37
The Discount Dilemma: Bargain or Trap?
Why STEW Trades Below Value
- Closed-End Structure: Unlike ETFs, CEFs can’t create new shares to meet demand
- Low Volume: 71k daily shares traded vs. 4M for SPY ETF
- Perception Issues: 2022 name change from “Boulder Growth” created brand confusion37
Historical Discount/Premium
| Year | Average Discount |
|---|---|
| 2021 | -18% |
| 2023 | -21% |
| 2025 | -23% |
Answering Investor FAQs
Is STEW’s Low P/E Ratio a Mirage?
The 2.98 P/E seems unbelievable next to the market average. This comes from:
- Accounting Rules: CEFs report investment gains as earnings
- Realized Losses: Tax harvesting of losing positions6
Verdict: Not directly comparable to operating companies’ P/Es
Can the 23% Discount Last Forever?
Three scenarios could close the gap:
- Activist Investor: Forces share buybacks
- Conversion to ETF: Eliminates discount mechanism
- Berkshire Rally: BRK.B gains make STEW too cheap to ignore34
Dividend Safety Check
| Year | Dividend Per Share | Payout Ratio |
|---|---|---|
| 2022 | $0.48 | 12% |
| 2024 | $0.66 | 15% |
Wisesheets data6
With dividends using just 15% of earnings, payments look sustainable barring market crash.
Risks You Can’t Ignore
- Board Age Factor:
- Average director age: 69 years
- Longest-serving member: 88 years old5
Why It Matters: Potential succession issues
- Liquidity Crunch:
- Berkshire’s Cash Hoard:
- $157 billion in cash = 22% of BRK.B’s value
- Could limit upside if markets rise3
How Professionals Use STEW
- Berkshire Proxy: Cheaper than buying BRK.B directly (0.77x price)
- Portfolio Stabilizer: 0.92 beta vs. market’s 1.01
- Tax Efficiency: Managed distributions vs. ETF capital gains
The Verdict: Who Should Consider STEW?
Good Fit For:
- Berkshire fans wanting discounted exposure
- Income investors needing 4% yield
- Market skeptics wanting cash buffers
Poor Fit For:
- Hands-off index investors
- Growth seekers wanting tech stocks
- Traders needing daily liquidity
Current Price Alert: At $16.84, STEW trades near its 52-week low of $14.19. Historical data shows the discount typically peaks before narrowing16.
Final Thought
This fund isn’t for everyone, but value-focused investors might find STEW’s combination of Berkshire exposure, deep discount, and income potential worth the liquidity trade-off. As with any concentrated investment, position sizing matters – most analysts suggest capping exposure at 5% of a portfolio37.
Disclosure: This analysis uses publicly available data and doesn’t constitute investment advice. Always conduct your own research or consult a financial advisor.
Citations:
- https://ycharts.com/companies/STEW
- https://www.marketscreener.com/quote/stock/SRH-TOTAL-RETURN-FUND-INC-11844/news/Fund-Presentation-STEW-49353927/
- https://seekingalpha.com/article/4720087-checking-in-on-stew-a-year-after
- https://srhfunds.com/fund-overview/stew/
- https://www.marketscreener.com/quote/stock/SRH-TOTAL-RETURN-FUND-INC-11844/company/
- https://www.wisesheets.io/STEW/dividend-history
- https://stockanalysis.com/stocks/stew/company/
- https://www.barrons.com/articles/berkshire-hathaway-warren-buffett-fund-1e1e51ad
- https://www.schwab.com/research/etfs/quotes/summary/stew
- https://finance.yahoo.com/quote/STEW/key-statistics/
