
When it comes to investing, following the money is a time-tested strategy. The NANC ETF—formally known as the Unusual Whales Subversive Democratic Trading ETF—takes this idea to the next level by tracking the public stock trades of Democratic members of Congress and their spouses.
In this article, we explain how the unique NANC ETF mirrors the stock trades of Democratic members of Congress. We cover its performance, top holdings, and whether it belongs in your portfolio.
Table of Contents:
- What Is the NANC ETF?
- Key facts about NANC:
- How Does the NANC ETF Work?
- NANC ETF Performance: How Has It Done?
- What Stocks Does NANC Hold?
- How Does NANC Choose Its Stocks?
- NANC ETF Dividend and Yield
- NANC ETF Fees and Expenses
- NANC ETF: Key Metrics at a Glance
- How Does NANC Compare to Other Thematic ETFs?
- NANC ETF FAQs
- Who Should Consider NANC ETF?
- NANC ETF: Pros and Cons
- Long-Tail and Trending Keywords for NANC ETF
- Conclusion
If you’re interested in a fund that blends political transparency with a data-driven investment approach, NANC stands out as one of the most talked-about thematic ETFs in 2025.
What Is the NANC ETF?
The NANC ETF is an actively managed exchange-traded fund that invests in U.S. equities purchased or sold by Democratic members of Congress and their spouses. The fund’s strategy is built on the premise that Congressional trades, disclosed under the STOCK Act, may offer unique market insights. By mirroring these trades, NANC aims to capture any informational edge that lawmakers might have due to their proximity to policy decisions and economic developments.
Unusual Whales Subversive Democratic Trading ETF (NANC)
Key facts about NANC:
- Full Name: Unusual Whales Subversive Democratic Trading ETF
- Ticker: NANC
- Inception Date: February 2, 2023
- Primary Exchange: CBOE
- Expense Ratio: 0.74%
- Assets Under Management: Around $215 million (as of May 2025)25
- Holdings: 158 stocks
- Dividend Yield: 0.21%, paid annually47
How Does the NANC ETF Work?
NANC’s strategy is simple but unique:
- The fund reviews public disclosures of trades made by Democratic members of Congress and their spouses, as required by the STOCK Act.
- These disclosures are filed with the Senate Office of Public Records or the Clerk of the House of Representatives.
- The fund then builds a portfolio of U.S. stocks that reflects these trades, adjusting its holdings as new disclosures are made.
What makes NANC different?
- It does not consider trades by Republican Congress members (there’s a separate ETF, GOP, for that).
- The portfolio is actively managed and rebalanced to stay current with Congressional activity.
- The fund’s approach is fully transparent, with holdings and methodology disclosed to investors.
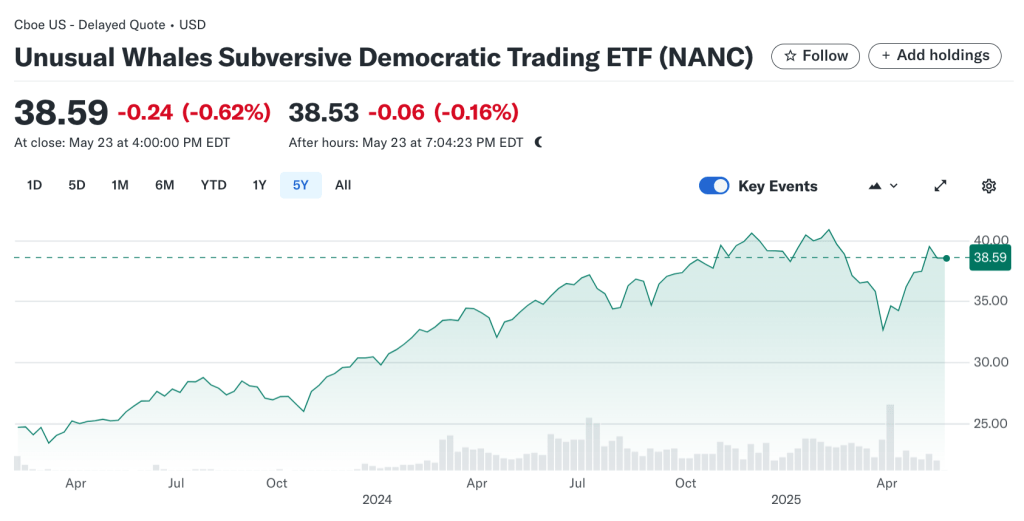
NANC ETF Performance: How Has It Done?
Performance is a key concern for any investor. Here’s how NANC has performed since its launch, compared to the S&P 500 Total Return Index:
| Period | NANC NAV | S&P 500 TR |
|---|---|---|
| 1 Month (Apr 2025) | +1.25% | -0.68% |
| 3 Months (Apr 2025) | -8.78% | -7.50% |
| 6 Months (Apr 2025) | -2.41% | -1.74% |
| Year-to-Date (Apr 2025) | -5.36% | -4.92% |
| 1 Year (Apr 2025) | +11.44% | +12.10% |
| Since Inception (Cumulative) | +47.51% | +40.03% |
| Since Inception (Annualized) | +19.07% | +16.32% |
Key takeaways:
- NANC has outperformed the S&P 500 since its inception, with a cumulative return of 47.51% versus the S&P 500’s 40.03%.
- Over the past year, NANC returned 11.44%, slightly trailing the S&P 500’s 12.10%.
- Short-term performance can be volatile and is not a reliable indicator of future results2.
What Stocks Does NANC Hold?
NANC’s portfolio is a who’s who of large-cap U.S. stocks, reflecting the most popular trades among Democratic lawmakers. As of May 2025, the ETF holds 158 stocks, with the top 10 accounting for nearly 47% of assets5.
Top 10 Holdings (May 2025):
| Company | Portfolio Weight |
|---|---|
| Nvidia (NVDA) | 9.66% |
| Microsoft (MSFT) | 7.85% |
| Amazon (AMZN) | 5.00% |
| Salesforce (CRM) | 4.17% |
| Alphabet (GOOGL) | 3.96% |
| Meta Platforms | 2.79% |
| KKR & Co | 0.55% |
| Vulcan Materials | 2.38% |
| Liberty Media F1 | 0.24% |
| Apple (AAPL) | 3.13% |
Sector allocation:
- Technology dominates, with top holdings like Nvidia, Microsoft, and Apple.
- Other sectors include financials, healthcare, consumer defensive, and industrials5.
Geographic exposure:
- 99.9% U.S. stocks, with a small allocation to Canada5.
How Does NANC Choose Its Stocks?
NANC’s stock selection is driven by Congressional disclosures, not traditional financial analysis. Here’s the process:
- Monitor STOCK Act Filings: The fund’s managers track new trades disclosed by Democratic Congress members and their spouses.
- Build Portfolio: NANC buys and sells stocks to match the reported trades, adjusting weights to reflect the size and frequency of Congressional activity.
- Rebalance Regularly: As new disclosures come in, the fund updates its holdings to stay in sync with the latest Congressional trades.
Why does this matter?
The idea is that members of Congress may have access to information or insights that give them an edge in the market. By following their trades, investors hope to capture some of this advantage.
NANC ETF Dividend and Yield
NANC pays an annual dividend, making it a potential source of passive income:
- Dividend Yield: 0.21% (as of May 2025)
- 2024 Dividend: $0.078 per share, paid in December47
- Payout Ratio: 5.64%
- Ex-Dividend Date: December 27, 2024
The yield is modest, reflecting the ETF’s focus on growth stocks rather than high-dividend payers.
NANC ETF Fees and Expenses
- Expense Ratio: 0.74%237
- This is higher than most broad-market ETFs, reflecting the cost of active management and the niche strategy.
- No front-end or deferred loads.
- No minimum investment.
NANC ETF: Key Metrics at a Glance
| Metric | Value |
|---|---|
| Net Assets | $215 million |
| Shares Outstanding | 5.53 million |
| NAV (May 2025) | $39.07 |
| Market Price (May 2025) | $39.10 |
| 52-Week Range | $31.20–$41.08 |
| Beta | 1.12 |
| Holdings | 158 |
| Dividend Yield | 0.21% |
| Expense Ratio | 0.74% |
How Does NANC Compare to Other Thematic ETFs?
| ETF | Strategy | Expense Ratio | 1-Year Return (Apr 2025) |
|---|---|---|---|
| NANC | Follows Democratic Congress trades | 0.74% | 11.44% |
| GOP | Follows Republican Congress trades | 0.74% | Similar |
| S&P 500 ETF | Broad U.S. market exposure | 0.03–0.09% | 12.10% |
| ARKK | Disruptive innovation stocks | 0.75% | Varies |
NANC ETF FAQs
What is the NANC ETF?
NANC is an actively managed ETF that invests in stocks traded by Democratic members of Congress and their spouses, based on public disclosures.
How often does NANC rebalance its portfolio?
NANC updates its holdings regularly as new Congressional trades are disclosed, ensuring the portfolio reflects the most current activity28.
What are the top holdings in NANC?
As of May 2025, the top holdings include Nvidia, Microsoft, Amazon, Salesforce, Alphabet, and Apple5.
Is NANC ETF a good investment?
NANC offers a novel way to track the market activity of politically influential individuals. While it has outperformed the S&P 500 since inception, it comes with higher fees and the performance edge may not persist. Always consider your risk tolerance and investment goals.
Does NANC pay a dividend?
Yes, NANC pays an annual dividend, with a current yield of 0.21%47.
What are the risks of investing in NANC?
- Political risk: The strategy depends on Congressional trading activity, which could change with new regulations.
- Concentration risk: Heavy exposure to large-cap tech stocks.
- High expense ratio: At 0.74%, it’s more expensive than most index ETFs.
- Short track record: Launched in 2023, so long-term performance is still uncertain.
Who Should Consider NANC ETF?
NANC is best for:
- Investors interested in thematic or alternative strategies
- Those who believe Congressional trades may offer an edge
- People looking to diversify beyond traditional index funds
- Those comfortable with higher fees for a unique approach
It’s not as good for:
- Investors seeking low-cost, broad-market exposure
- Those who want high dividend yields
- Anyone uncomfortable with the political nature of the strategy
NANC ETF: Pros and Cons
Pros:
- Unique, transparent strategy based on Congressional disclosures
- Exposure to large-cap U.S. stocks, especially in tech
- Outperformed the S&P 500 since inception
- Annual dividend, albeit modest
Cons:
- High expense ratio compared to index funds
- Short performance history
- Returns may not persist if Congressional trading patterns change
- Political and regulatory risks
Long-Tail and Trending Keywords for NANC ETF
- NANC ETF performance 2025
- NANC ETF holdings list
- How does NANC ETF work?
- NANC ETF vs S&P 500
- NANC ETF dividend yield
- NANC ETF expense ratio
- Best political trading ETFs
- Congressional stock trading ETF
- Unusual Whales ETF explained
- Should I buy NANC ETF?
Key Takeaways
- NANC ETF tracks the stock trades of Democratic members of Congress and their spouses, offering a unique, politically themed investment strategy.
- The fund has outperformed the S&P 500 since its 2023 launch, but comes with a higher expense ratio and a short track record.
- Top holdings are dominated by large-cap tech stocks like Nvidia, Microsoft, and Amazon.
- NANC pays a modest annual dividend and is best suited for investors seeking thematic exposure and willing to accept higher fees for a novel approach.
Conclusion
The NANC ETF stands out in the crowded ETF landscape by giving investors a way to follow the trades of some of the most influential people in the country—Democratic members of Congress.
With a transparent, data-driven approach and a focus on large-cap U.S. equities, NANC offers a blend of political intrigue and financial opportunity. While its performance has been strong since inception, always weigh the higher fees, short track record, and unique risks before adding it to your portfolio.
If you’re looking for a fresh angle on market investing in 2025, NANC is one ETF worth watching.
Citations:
- https://ppl-ai-file-upload.s3.amazonaws.com/web/direct-files/collection_ba0d45e7-4185-409f-b191-3462b73eb57a/42cbeeac-1543-419d-9dbd-94d472b6fa55/paste.txt
- https://subversiveetfs.com/nanc/
- https://markets.ft.com/data/etfs/tearsheet/summary?s=NANC%3AASE
- https://stockanalysis.com/etf/nanc/dividend/
- https://www.tipranks.com/etf/nanc/holdings
- https://seekingalpha.com/symbol/NANC/momentum/performance
- https://stockanalysis.com/etf/nanc/
- https://www.tipranks.com/etf/nanc
- https://finance.yahoo.com/quote/NANC/performance/
- https://www.morningstar.com/etfs/bats/nanc/performance
- https://www.marketwatch.com/investing/fund/nanc
- https://www.moneycontrol.com/mf/etf/
- https://finance.yahoo.com/quote/NANC/holdings/
- https://www.marketwatch.com/investing/fund/nanc/holdings
- https://stockanalysis.com/etf/nanc/holdings/
- https://www.etf.com/tools/etf-stock-holdings
- https://www.morningstar.com/etfs/bats/nanc/portfolio
- https://www.tradingview.com/symbols/CBOE-NANC/holdings/
Related Posts:
- Top Mexico ETF Funds
- SGOV ETF: Simple Guide for Beginners
- Consumer Staples ETFs: Your Complete 2025 Investment Guide
- Dividend ETF to Maximize Your Income in 2025
- XOVR ETF: The First Crossover ETF Combining Public and Private Equity
- Cocoa ETF: A Complete Guide for 2025
- European Defense ETF: A Comprehensive Guide for 2025
- YieldMax ETFs: High-Yield, High-Risk Income Strategies
- Defiance ETF
- Investing 101: ETF vs Stocks
