
investors have the opportunity to increase both their total investment gains and the regular cash payments they receive. This can be achieved by combining two investment approaches:
- Dividend-Growth Funds: These funds invest in companies that consistently pay and typically increase their dividends over time, aiming for both income and capital appreciation.
- Option-Overlay High-Yield Strategies: These strategies utilize options, typically by selling call options on underlying assets, to generate additional income, which can result in higher distribution yields.
This guide will explain how to construct an investment portfolio designed to generate income with a medium level of risk. We will detail the specific advantages of different types of Exchange Traded Funds (ETFs) that employ these strategies. Furthermore, we will provide information on managing tax implications, reinvesting income for growth, and mitigating potential losses (downside risk) for the next 12 months and beyond.
ETF Income in 2025
Over the past 15 years, a small group of seven large technology companies, often referred to as the “magnificent seven,” have experienced significant growth. This growth has, however, led to a compression of the average dividend yield from the broader stock market to approximately 1.4%.
For investors whose primary objective is to receive regular cash payments from their investments, this low yield presents a challenge. Consequently, these “income investors” are increasingly seeking out specialized dividend-focused Exchange Traded Funds (ETFs) that are specifically structured to generate higher levels of income.
Key Selection Metrics
| Metric | Why It Matters | Target Range |
|---|---|---|
| SEC 30-Day Yield | Forward income indicator | ≥3% for core, ≥7% for overlay funds |
| 5-Year Dividend CAGR | Signals sustainability | ≥5% for growth funds56 |
| Expense Ratio | Direct drag on income | ≤0.35% for core, ≤0.75% for overlays |
| 12-Month Total Return Volatility | Risk proxy | ≤18% for medium-risk profile |
| Payout Frequency | Cash-flow timing | Monthly or quarterly |
ETF Funds for Growing Dividends
These are investment funds (ETFs) that focus on companies that not only pay regular cash payments (dividends) but also tend to increase those payments over time.
1. Schwab U.S. Dividend Equity ETF (SCHD)

SCHD focuses on high quality companies, spreads investments across different types of industries, and doesn’t change its holdings very often, which can reduce costs. This makes it a solid choice for the main part of an investment portfolio focused on income.
What it Pays (Yield): Currently, if you invested in SCHD, you could expect to receive about 3.8% of your investment back in cash payments over a year. This figure can vary slightly but stays in that range.
How Much it Grew (10-Year Total Return): Over the last 10 years, if you had invested in SCHD, your investment would have grown by an average of 10.28% each year, including the dividends you received. Since it started, its average annual growth has been even higher, at 11.49%.
Cost to Own (Expense Ratio): It’s very inexpensive to own, costing only 0.06% of your investment per year. This is a very low fee.
How Fast Dividends Grew (Dividend CAGR – 10 Years): The cash payments (dividends) from SCHD have grown by about 10% to 11% per year on average over the last decade. This means the income you receive tends to increase significantly over time.
How it Works (Strategy): SCHD aims to follow a specific index (like a blueprint) called the Dow Jones U.S. Dividend 100™ Index. It picks about 100 large U.S. companies that have a strong track record of paying consistent dividends. It looks for financially healthy companies by checking things like their cash flow, how well they use their money to make a profit, how likely they are to keep paying dividends, and their overall financial strength.
Why it’s Useful (Rationale): SCHD’s increasing dividend payments help protect your buying power against rising prices (inflation). Also, its price tends to be less volatile (less up-and-down movement) than the overall stock market (S&P 500), making it a more stable part of an income-focused portfolio. It’s considered a reliable core investment.
2. Vanguard High Dividend Yield ETF (VYM)
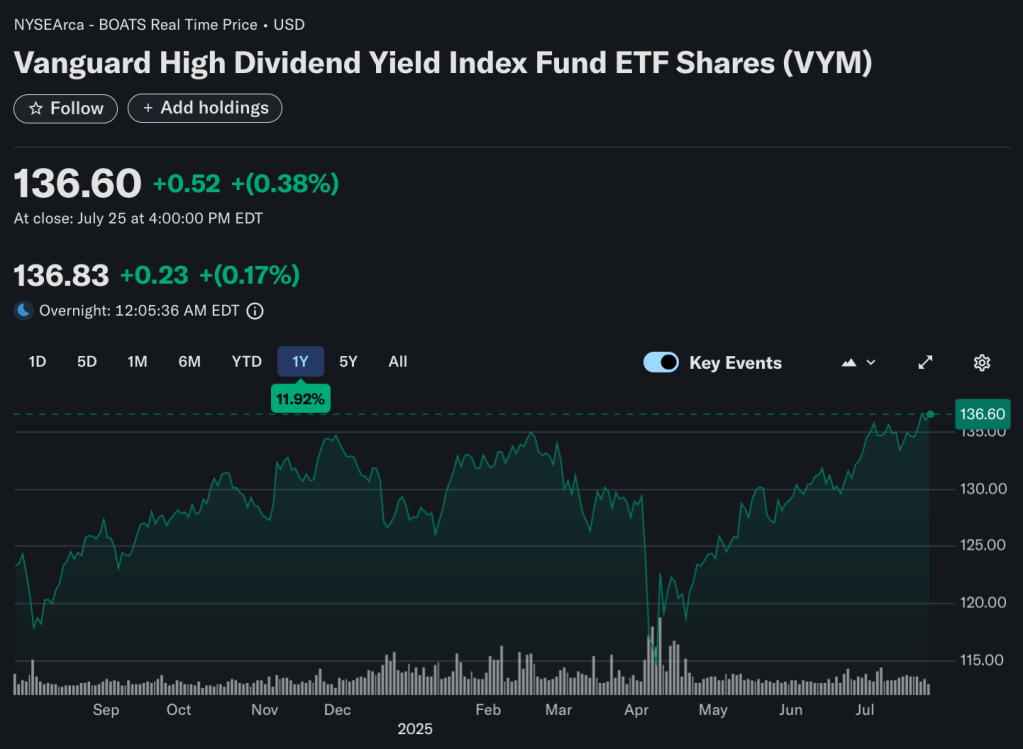
What it Pays (Yield): VYM generally pays out around 2.58% to 3.15% of your investment in cash payments over a year.
How Much it Grew (10-Year Total Return): Over the last 10 years, VYM has grown by an average of 9.37% to 10.47% each year, including dividends.
Cost to Own (Expense Ratio): Like SCHD, VYM is also very inexpensive to own, costing only 0.06% of your investment per year.
How Fast Dividends Grew (Dividend CAGR – 10 Years): The cash payments (dividends) from VYM have grown by about 6.2% to 7% per year on average over the past decade. This growth is steady but slower than SCHD’s.
How it Works (Strategy): VYM tracks the FTSE High Dividend Yield Index. It primarily invests in large and medium-sized U.S. companies that offer higher-than-average dividend payments. It selects the companies with the highest dividends and then weights them based on their total market value. It specifically avoids investing in Real Estate Investment Trusts (REITs) and spreads its investments widely across many different industries, with a particular focus on financial companies, healthcare, and consumer goods companies. VYM aims to provide dependable income while managing risk by investing in a large variety of companies.
Why it’s Useful (Rationale): VYM holds a much larger number of companies (around 450) compared to SCHD (around 100). This broader diversification reduces the risk if any single company performs poorly. It also complements SCHD, which focuses more on specific quality criteria, by providing a wider market exposure.
3. iShares Core High Dividend ETF (HDV)
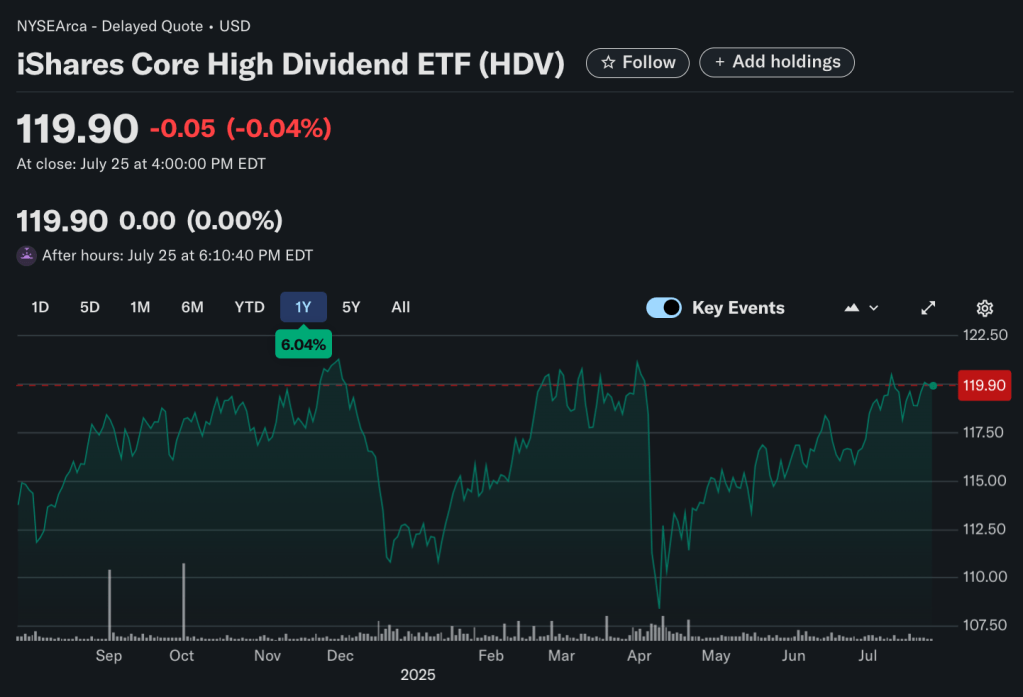
The main goal of HDV is to provide higher-than-average income, with some potential for the investment itself to grow in value, all while managing the risk by picking quality companies and not concentrating too much in any single one.
What it Pays (Yield): If you invested in HDV, you would currently expect to receive about 3.39% of your investment back in cash payments over a year. The expected future yield is similar, ranging from 3.05% to 3.39%.
How Much it Grew (10-Year Total Return): Over the last 10 years, an investment in HDV would have grown by an average of 8.66% each year, including the cash payments. Since the fund started, its average annual growth has been 9.92%.
Cost to Own (Expense Ratio): This fund is also very low-cost, with an annual fee of 0.08% of your investment.
How Fast Dividends Grew (Dividend CAGR – 10 Years): The cash payments (dividends) from HDV have grown by about 5.9% to 6% per year on average over the last decade.
How it Works (Strategy): HDV aims to follow a specific index called the Morningstar Dividend Yield Focus Index. This index includes 75 U.S. companies that pay high dividends. The fund selects companies based on their strong financial health, consistent earnings, and their ability to continue paying dividends. It gives more weight to companies that offer higher dividend yields, often focusing on industries like energy, utilities, and telecommunications.
Why it’s Useful (Rationale): HDV’s current higher income payment helps to balance out the slightly lower current payments from a fund like SCHD. It also selects companies based on their strong financial positions and competitive advantages (what Morningstar calls “Economic Moat”), which adds a layer of quality control.
| Core Fund | Yield | Dividend CAGR | Expense | Rebalance Frequency | Strengths |
|---|---|---|---|---|---|
| SCHD | 3.77% | 8.6%5 | 0.06% | Annual | High quality screens, low turnover |
| VYM | 3.14% | 6.2% (10 Y)8 | 0.06% | Quarterly | Broadest sector coverage |
| HDV | 4.04% | 4.1% (5 Y)9 | 0.08% | Quarterly | Defensive, energy tilt |
High-Yield Covered-Call ETFs
“Covered-call ETFs” are a type of investment fund designed to generate higher income. They do this by giving up some of the potential for large growth in the stock’s price in exchange for regular payments from selling “options.” This strategy is particularly effective when stock prices are moving sideways rather than consistently going up or down.
| ETF | Yield | Underlying Index/Strategy | Payout Freq. | Expense | Beta (vs S&P) |
|---|---|---|---|---|---|
| JEPI | 8.30%3 | Low-vol S&P equities + ELNs | Monthly | 0.35% | 0.5311 |
| JEPQ | 11.23%4 | Nasdaq-100 ELNs | Monthly | 0.35% | 0.68 |
| XYLD | 9.47%10 | S&P 500 buy-write | Monthly | 0.60% | 0.5010 |
| QYLD | 12.82% TTM12 | Nasdaq-100 buy-write | Monthly | 0.60% | 0.48 |
| RYLD | 11.9% TTM12 | Russell 2000 buy-write | Monthly | 0.60% | 0.74 |
4. JPMorgan Equity Premium Income ETF (JEPI)
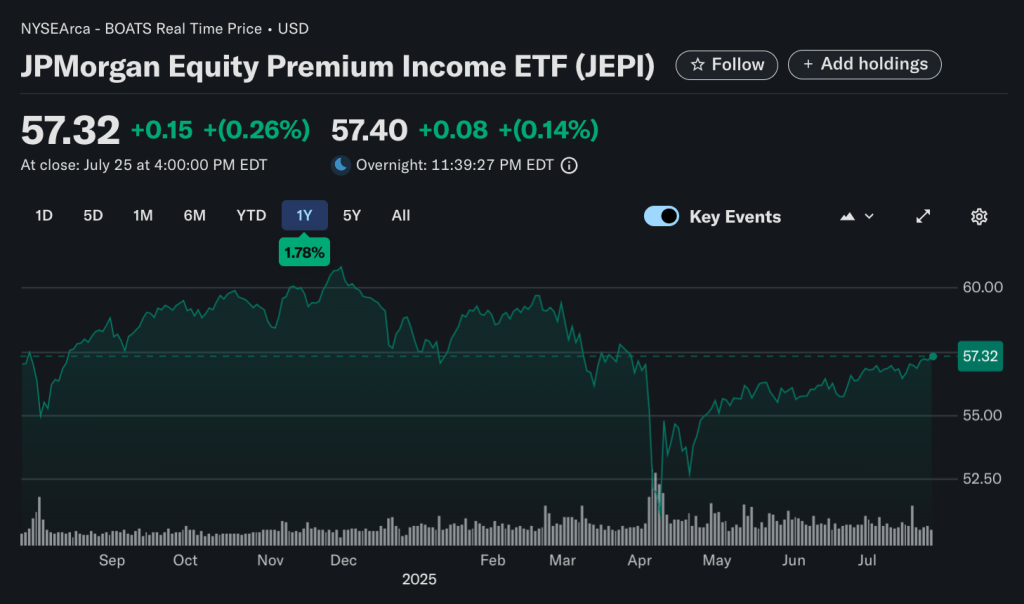
JEPI aims to provide income by using a strategy involving “equity-linked notes” instead of directly selling options on individual stocks. This approach allows it to capture income from selling options while still allowing for more of the stock’s potential growth compared to other funds that use a simpler option-selling method.
Its 26.8% increase in dividend payments so far in 2025 highlights its ability to generate significant income from these option strategies.
Why it’s Useful (Rationale): JEPI is considered to have the most favorable balance of risk and reward among these types of income-generating funds. It’s suggested for a 25% allocation in a portfolio.
5. JPMorgan Nasdaq Equity Premium Income ETF (JEPQ)
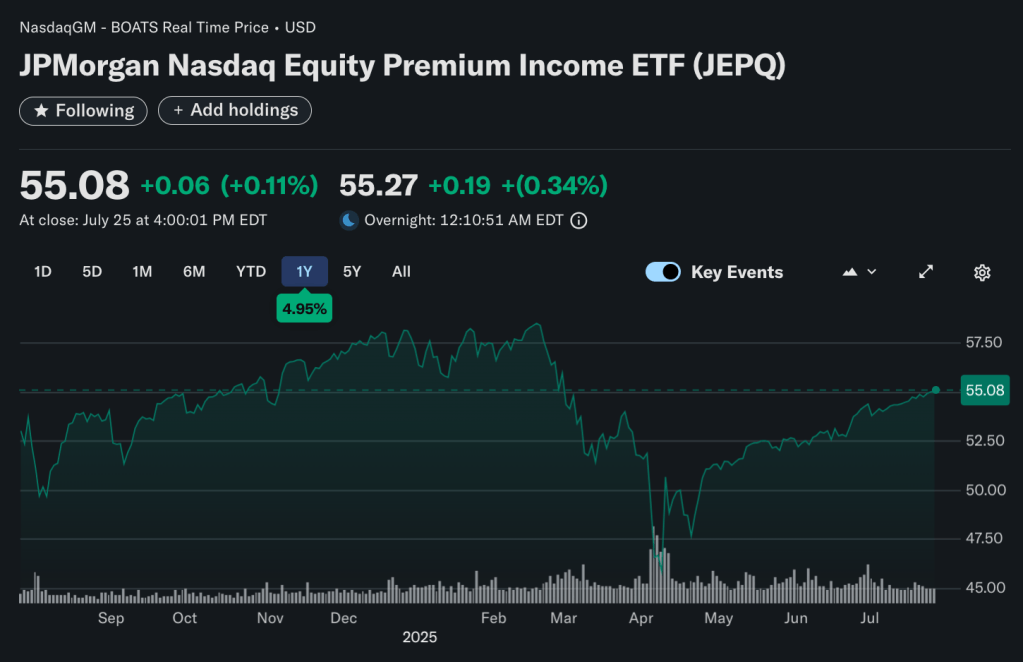
JEPQ complements JEPI, which tends to focus on “value” companies (companies that might be considered undervalued by the market).
JEPQ aims for a higher income because it invests in companies from the Nasdaq 100 Index, which can be more volatile (meaning their prices move up and down more). This higher volatility allows it to generate more income from selling options. Given its potentially higher price swings, a 15% allocation is suggested.
What it Pays (Yield): JEPQ’s annual cash payments (yield) currently range from 11.2% to 12.9%. While many reports indicate an annualized yield of 11.2%, the actual payments over the past 12 months have sometimes reached close to 12.9%, especially when the market has been more volatile.
How Much it Grew (10-Year Total Return): Since JEPQ only started in May 2022, there is no 10-year growth record available yet. However, since its launch in May 2022 until June 2025, the fund has grown by approximately 14.6% per year, including distributions.
Cost to Own (Expense Ratio): The annual fee for JEPQ is 0.35%.
How Fast Dividends Grew (Dividend CAGR – 10 Years): Because the fund is relatively new, a 10-year dividend growth rate isn’t available. However, in its first year, its dividend payments grew by 25.6%. Since it began in 2022, the annual dividend payment has increased significantly, from $3.85 in 2022 to $6.18 for the most recent 12-month period. This shows rapid growth in its distributions during a period of market volatility.
How it Works (Strategy): JEPQ invests in a diverse collection of large companies listed on the Nasdaq-100 stock exchange. Additionally, it uses a special strategy involving “equity-linked notes” to sell “call options” on the Nasdaq-100 Index that are “out-of-the-money” (meaning the option would only become valuable if the index price moves up significantly). This combined approach generates monthly income from the sale of these options, providing a high level of regular cash payments. This strategy also helps to reduce how much the portfolio’s value swings up and down and limits some of its potential for very high growth.
The overall goal is to achieve more stable returns with less sensitivity to market changes than the Nasdaq-100 itself, while providing consistent monthly income and attractive overall returns.
6. Global X S&P 500 Covered Call ETF (XYLD)
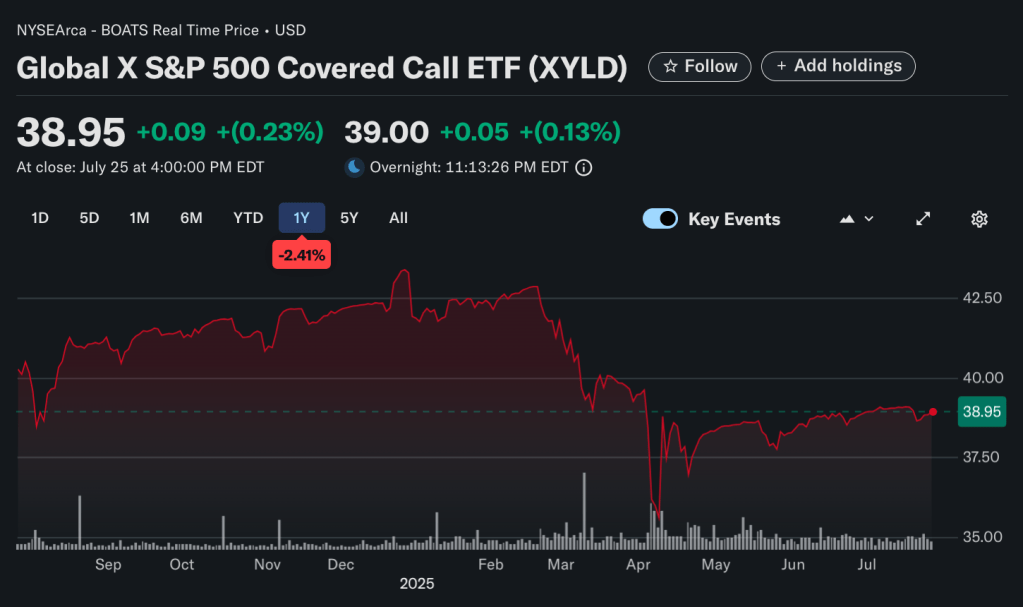
XYLD is designed to provide high current income, especially when the stock market is moving up and down a lot. It tends to grow slower than the S&P 500 in strong rising markets because its growth potential is limited
What it Pays (Yield): As of July 2025, XYLD has paid out about 13.4% of its value in cash payments over the past year.
How Much it Grew (10-Year Total Return): Over the last 10 years, an investment in XYLD would have grown by an average of 6.93% each year (including cash payments), whether calculated by its underlying value or its market price.
Cost to Own (Expense Ratio): The annual fee for XYLD is 0.60%.
How Fast Dividends Grew (Dividend CAGR – 10 Years): The growth rate of XYLD’s cash payments (dividends) can vary a lot because it depends on the income generated from selling options. In strong market years, growth has typically been around 5-7%, but in volatile periods, it can be much higher (for example, 37.27% over the last year). A consistent long-term average is not regularly reported due to this variability.
How it Works (Strategy): XYLD holds all the stocks in the S&P 500 index. Additionally, every month, it sells “call options” on the entire S&P 500 index that are “at-the-money” (meaning the option’s price is close to the current index price). This “buy-write” strategy generates immediate income from the sale of these options, which is then paid out monthly. However, by selling these options, the fund gives up most of the potential for significant growth if the S&P 500 goes up sharply.
Supplementary Niche Funds
These are additional funds that can serve specific purposes in an income-focused portfolio.
SPDR Portfolio S&P 500 High Dividend ETF (SPYD)
- What it Pays (Yield): SPYD currently pays out about 4.45% in cash payments.
- How it Works (Strategy): This fund tracks an index of the 80 highest-yielding companies within the S&P 500. Its holdings are reviewed and adjusted twice a year.
- Why it’s Useful: It includes investments in mid-sized companies and Real Estate Investment Trusts (REITs), which might not be heavily represented in funds like SCHD or VYM, offering broader exposure.
iShares 20-Year Treasury Covered Call ETF (TLTW)
- What it Pays (Yield): TLTW currently pays out a very high yield of 19.7%.
- How it Works (Strategy): This fund invests in long-term U.S. Treasury bonds (government debt) and then uses an “option overlay” strategy by selling call options on these bonds. This strategy aims to generate income.
- Why it’s Useful: By holding long-term Treasury bonds, it offers some protection against stock market crashes, as government bonds often perform well when stocks fall. The income generated from options is an added benefit.
- Recommendation: It’s suggested for tactical use, meaning it should be used strategically and comprise a small portion of the portfolio (5% or less).
12-Month Tactical Allocation
| Segment | ETF | Target Weight | Yield Contribution |
|---|---|---|---|
| Core Dividend-Growth (50%) | SCHD 30% VYM 10% HDV 10% | 50% | 1.8% |
| Covered-Call Overlay (40%) | JEPI 25% JEPQ 10% XYLD 5% | 40% | 3.9% |
| High-Dividend Value (8%) | SPYD 8% | 8% | 0.36% |
| Tactical Income Hedge (2%) | TLTW 2% | 0.4% | |
| Total | 100% | 6.46% blended forward yield |
Blended yield adds 2.6% in option premiums versus a pure dividend approach while keeping portfolio beta near 0.65.
Implementation & Trading Calendar
Ex-Dividend Capture
| ETF | Typical Ex-Dates | 2025 Q3 Next Ex | Hold-Through Recommendation |
|---|---|---|---|
| SCHD | Mar, Jun, Sep, Dec15 | Sep 24 ’25 | Buy ≥2 days before; hold at least 63 days to qualify for reduced tax rate |
| JEPI | Monthly3 | Aug 1 ’25 | Can rotate monthly lots to defer gains |
| JEPQ | Monthly16 | Aug 1 ’25 | Same strategy as JEPI |
| SPYD | Mar, Jun, Sep, Dec14 | Sep 20 ’25 (est.) | – |
| XYLD | Monthly10 | Aug 15 ’25 | – |
Combine calendar tracking with dividend-reinvestment plans (DRIPs) to compound shares in tax-advantaged accounts.
Dividend Reinvestment vs. Cash-Out
- Tax-Deferred (IRA, 401-k): Autodrip everything to harness compounding.
- Taxable: Reinvest core funds (SCHD/VYM) which qualify for 15% tax rate; take JEPI/JEPQ/XYLD distributions in cash to pay taxes and rebalance.
Tax-Efficiency Playbook
- Qualified Dividend Percentage: SCHD > 90% qualified; JEPI ≈55% due to option premiums. 17
- Return-of-Capital: Covered-call funds often classify 20 – 40% of payouts as ROC, deferring taxes until sale. Confirm each January via 1099-DIV.
- Loss-Harvesting Window: If JEPQ falls >10% within 31 days of distribution, harvest losses against ordinary income while maintaining exposure with QQQI.1
Risk-Management Framework
| Risk | Mitigation |
|---|---|
| Equity Drawdown | 10% TLTW tail hedge plus JEPI low-vol basket lowers beta3 |
| Premium Shortfall (low VIX) | Core dividend ETFs supply baseline income |
| Rate Spikes | HDV energy bias and TLTW duration hedge offset |
| Legislative Tax Changes | Keep 60% of yield in qualified dividends (SCHD, VYM, SPYD) |
Set a trailing 10% stop on JEPQ only, as it’s the most volatile component.
Scenario Analysis
Bull Market (>15% S&P gain)
- Covered-call funds underperform on total return but still print 7 – 10% yield.
- Core growth ETFs appreciate; rotate 5% out of JEPI into SCHD if VIX <14.
Range-Bound (±8%)
- Option premiums elevated; expect 6.5%+ portfolio yield to outpace price returns.
Bear Market (≥20% drop)
- TLTW rallies on flight-to-quality; option income remains robust due to high volatility.
- Reinvest distributions to average down core positions.
Frequently Asked Questions
Q: Why not 100% covered-call ETFs for maximum cash?
A: Pure buy-writes suffer NAV stagnation; mixing with dividend-growers preserves capital appreciation.18210
Q: Could I swap SCHD for FDVV?
A: FDVV’s 3.16% yield is lower and dividend history shorter; keep SCHD as anchor.
Q: Are these ETFs option-margin eligible?
A: All listed funds are 1940-Act regulated; most brokerage platforms allow margin loans up to 50% except TLTW (often 30% due to duration risk).
Conclusion
By blending high-quality dividend-growth ETFs with a calibrated dose of covered-call strategies, investors with medium risk tolerance can realistically target a 6.4% cash yield while maintaining upside participation and moderating volatility. Diligent ex-date scheduling, smart tax placement, and tactical hedges will maximize net income over the next 12 months and set up long-term compounding thereafter.
Related Articles:
- Top Mexico ETF Funds
- SGOV ETF: Simple Guide for Beginners
- Consumer Staples ETFs: Your Complete 2025 Investment Guide
- Dividend ETF to Maximize Your Income in 2025
- XOVR ETF: The First Crossover ETF Combining Public and Private Equity
- Cocoa ETF: A Complete Guide for 2025
- European Defense ETF: A Comprehensive Guide for 2025
- YieldMax ETFs: High-Yield, High-Risk Income Strategies
- Defiance ETF
- Investing 101: ETF vs Stocks
- https://www.fgcapitaladvisors.com/top-10-covered-call-etfs-for-consistent-fixed-income-and-high-yields
- https://money.usnews.com/investing/articles/high-yield-covered-call-etfs-income-investors-will-love
- https://stockanalysis.com/etf/jepi/dividend/
- https://stockanalysis.com/etf/jepq/dividend/
- https://stockanalysis.com/etf/schd/dividend/
- https://stockevents.app/en/stock/SCHD/dividends
- https://www.schwabassetmanagement.com/products/schd
- https://investor.vanguard.com/investment-products/etfs/profile/vym
- https://www.ishares.com/us/products/239563/ishares-high-dividend-etf
- https://www.globalxetfs.com/funds/xyld/
- https://finance.yahoo.com/quote/JEPI/performance/
- https://stockanalysis.com/list/covered-call-etfs/
- https://marketchameleon.com/Overview/JEPI/Dividends/
- https://etfdb.com/index/sp-500-high-dividend-index/
- https://www.wallstreethorizon.com/SCHD-dividend-calendar
- https://stockevents.app/en/stock/JEPQ/dividends
- https://am.jpmorgan.com/us/en/asset-management/adv/products/jpmorgan-equity-premium-income-etf-etf-shares-46641q332
- https://www.morningstar.com/best-investments/dividend-index-funds
- https://www.nerdwallet.com/article/investing/high-dividend-etfs
- https://www.invesco.com/us/financial-products/etfs/product-detail?audienceType=Investor&ticker=SPHD
- https://www.dividend.com/dividend-etfs/
- https://www.aamlive.com/ETF/Detail/SPDV
- https://etfdb.com/compare/dividend-yield/
- https://www.rexshares.com/rex-covered-call-etfs/
- https://www.ssga.com/us/en/intermediary/etfs/spdr-portfolio-sp-500-high-dividend-etf-spyd
- https://finance.yahoo.com/quote/SPYD/
- https://www.alliancebernstein.com/us/en-us/investments/products/etf/equities/ab-us-high-dividend-etf.-.00039J400.html
- https://etfdb.com/etfs/investment-style/buywrite/
- https://investor.vanguard.com/investment-products/etfs/profile/voo
- https://www.youtube.com/watch?v=Fy6WSP-a_sc
- https://www.dripcalc.com/jepi-dividend-calculator/
- https://ycharts.com/companies/JEPI/dividend_yield
- https://www.digrin.com/stocks/detail/JEPQ/
- https://seekingalpha.com/article/4797622-schd-income-yield-and-upside-potential
- https://stockevents.app/en/stock/JEPI/dividends
- https://www.tipranks.com/etf/jepq/dividends
- https://www.equitymaster.com/research-it/indices/dividend
- https://www.youtube.com/watch?v=RpY1oEFk6XY
- https://www.nasdaq.com/market-activity/etf/jepq/dividend-history
- https://seekingalpha.com/article/4780684-schd-2025-annual-reconstitution-turned-out-to-be-ill-timed
